
Getting Started
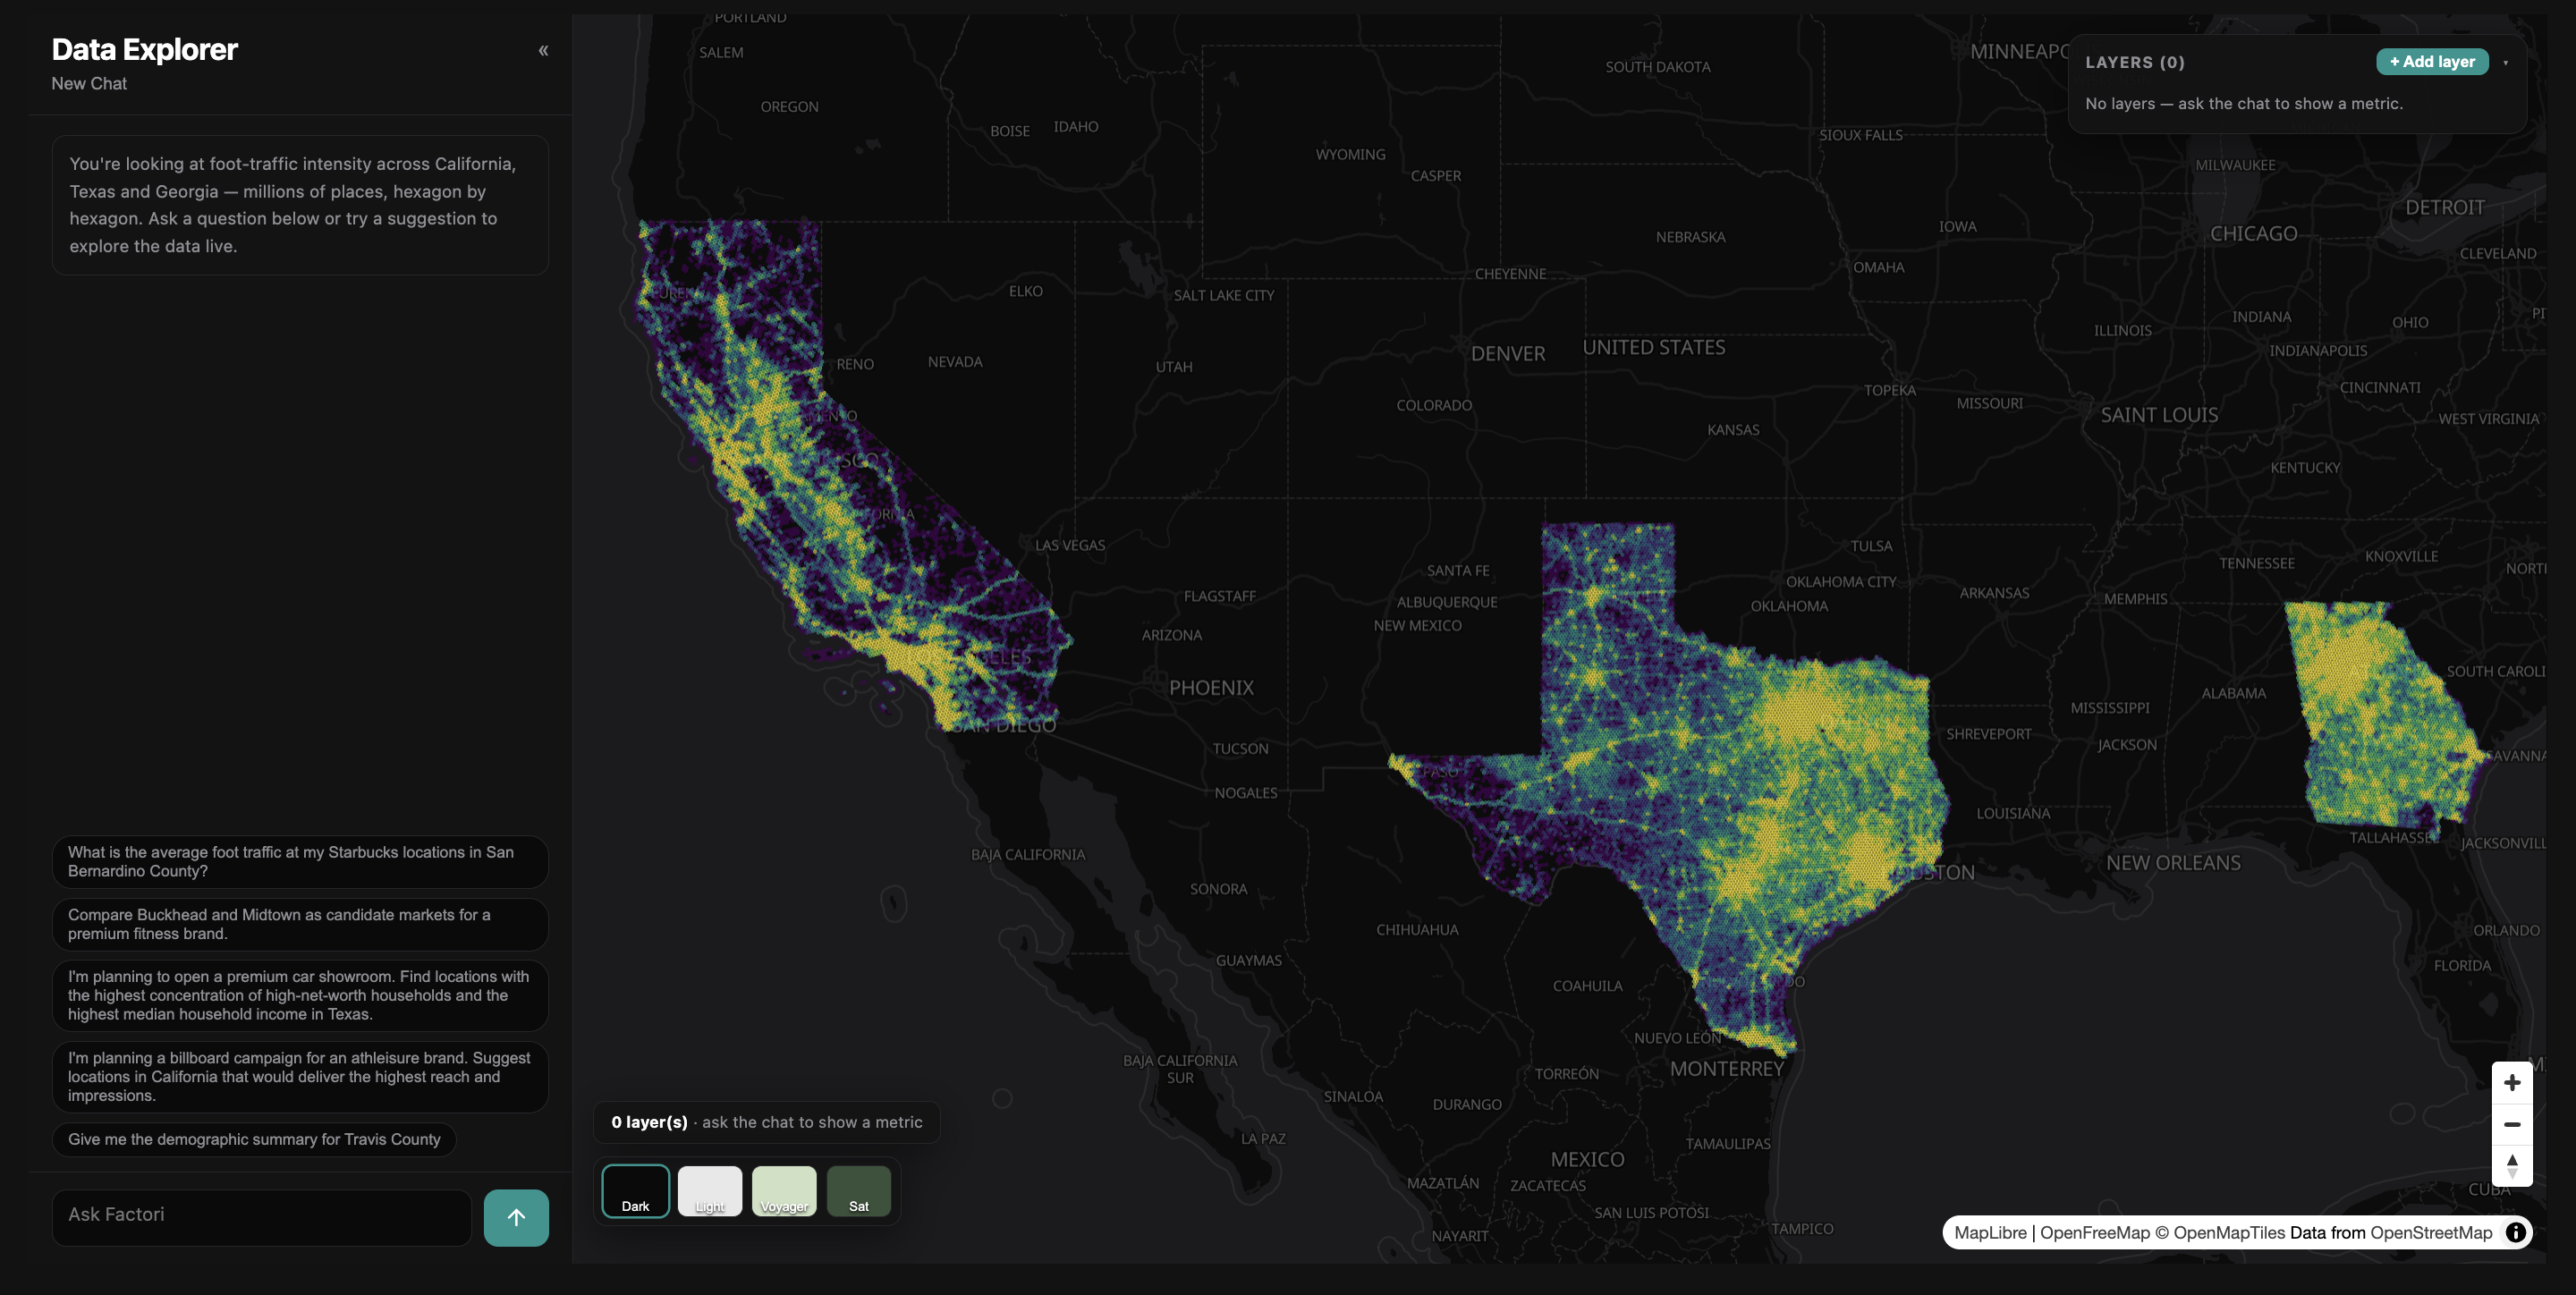
Data Explorer has three parts: the chat panel on the left, the map in the middle and the Layers panel on the top right.
There are two ways to build your view. Use whichever fits how you like to work.
Option A: Just ask
Type a question in the box at the bottom left and press Enter. The assistant figures out what you mean, updates the map and explains the result.
Not sure where to start? Click one of the suggested questions on the opening screen
Option B: Build a view manually
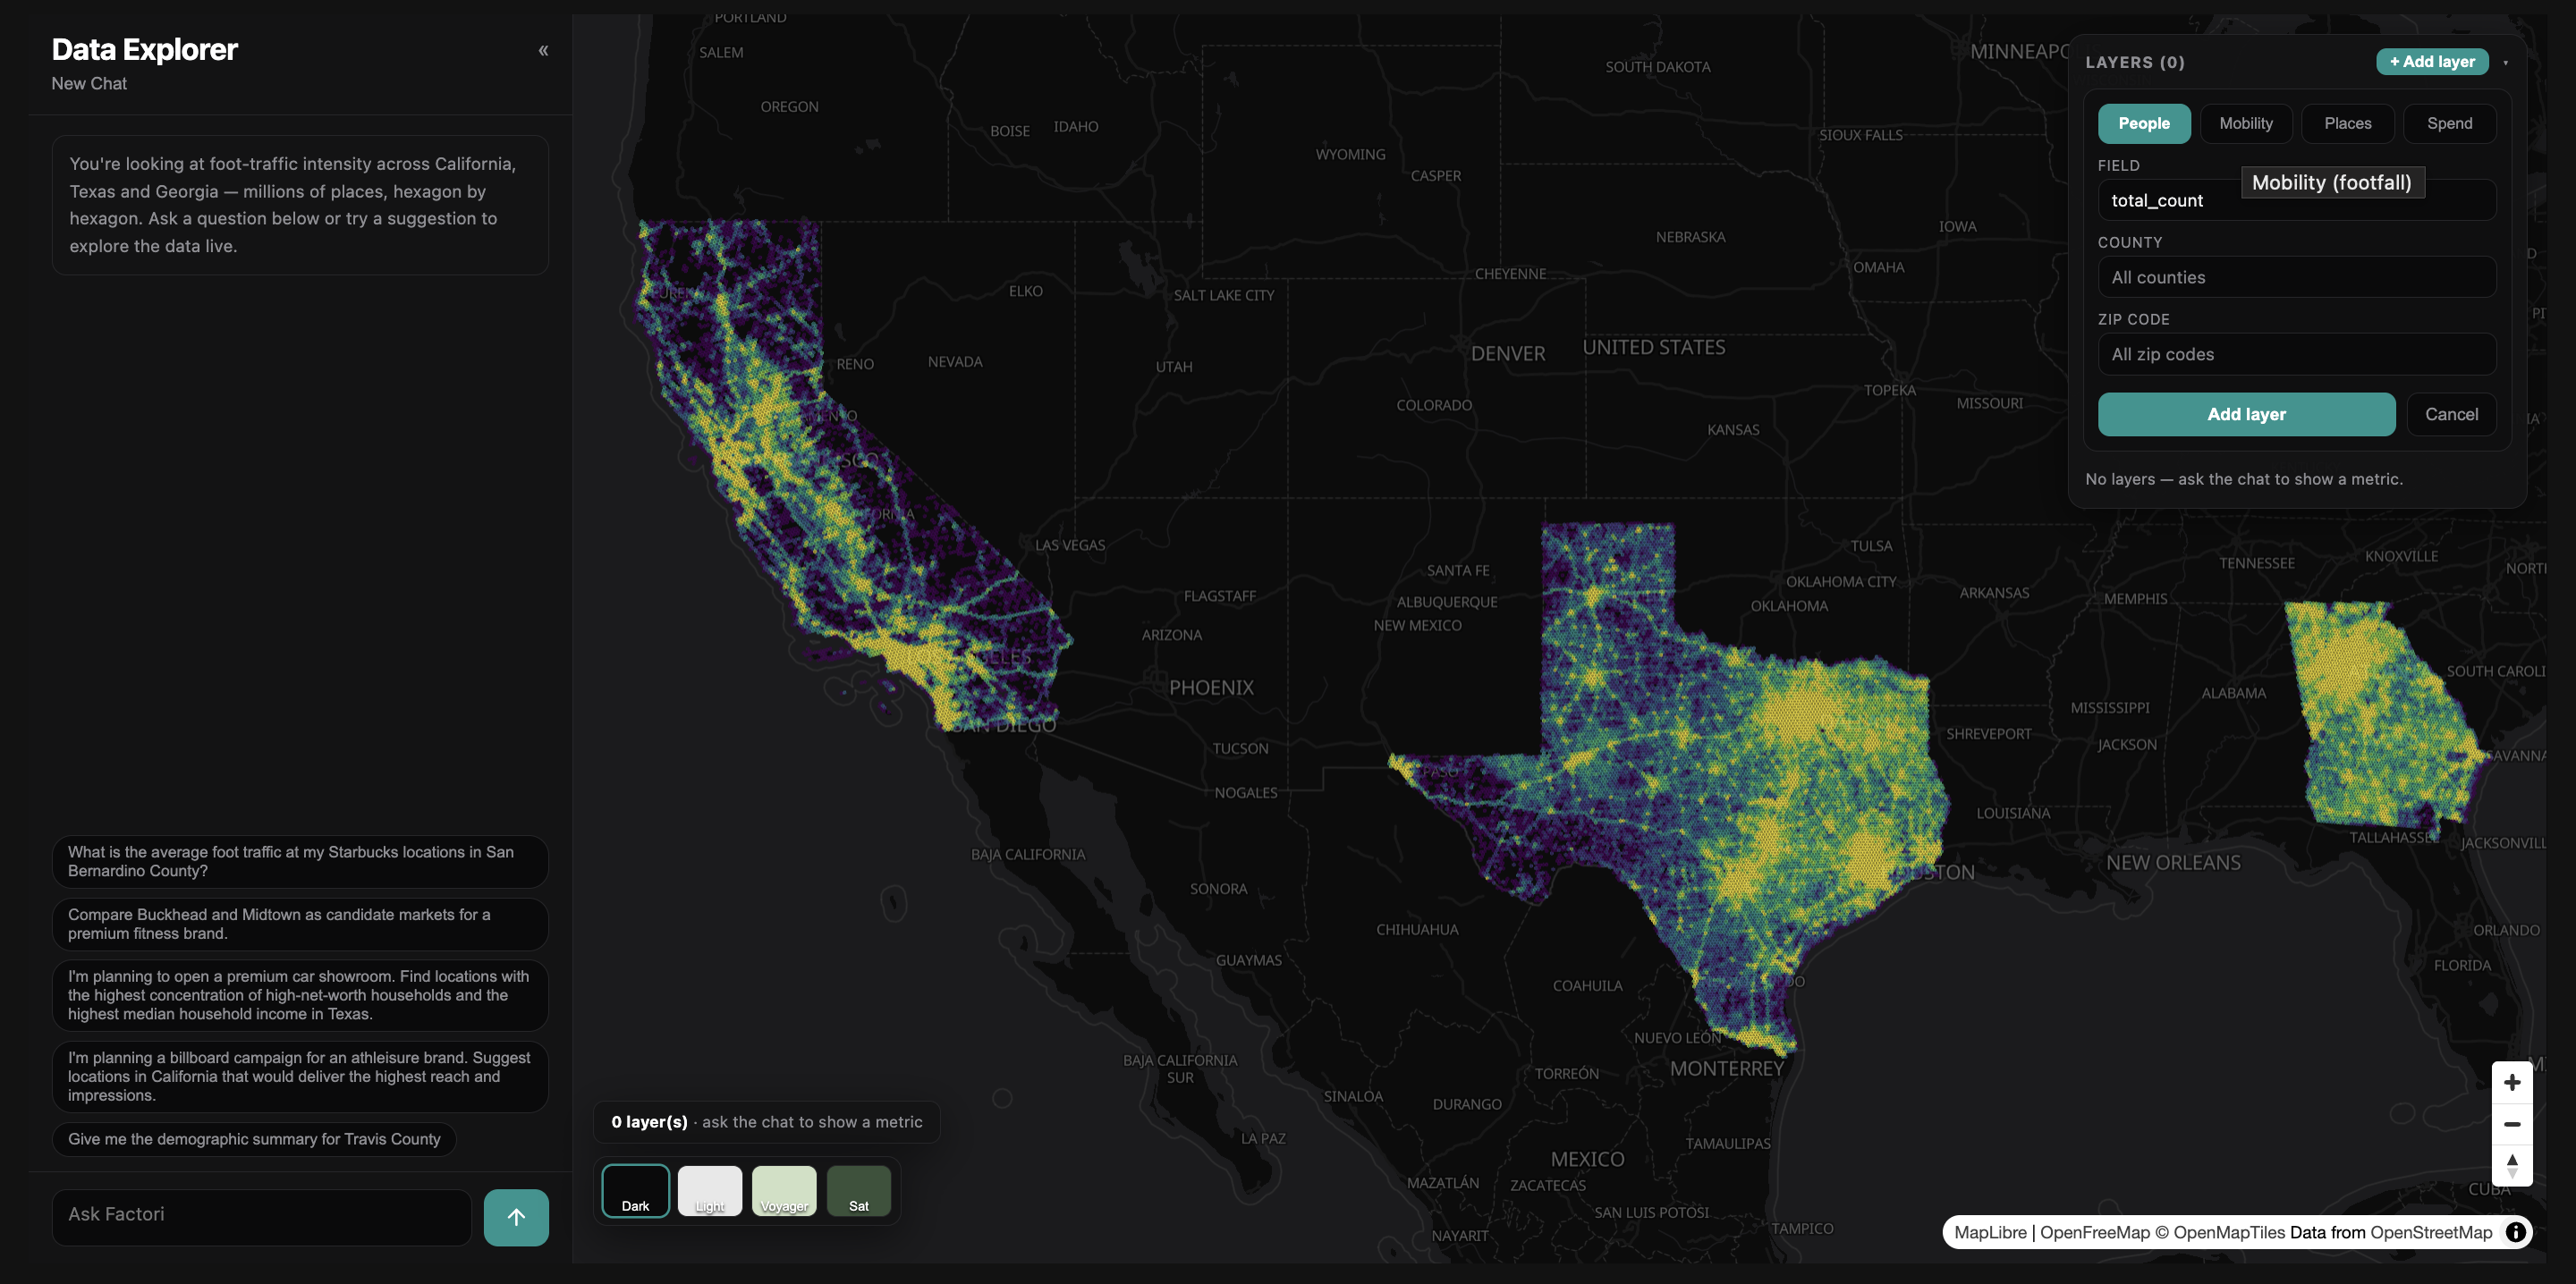
Click + Add layer in the top right, pick a dataset tab (People, Mobility, Places, or Spend), choose a field, optionally narrow to a county or ZIP and click Add layer.
This works well when you already know the exact metric you want.
Questions that work well
→ People: "Give me a demographic summary for Travis County"
→ Movement: "How busy is Midtown Atlanta?"
→ Places: "Plot all Starbucks in Georgia"
→ Spend: "Where is the highest average ticket in Georgia?"
→ Combined: "Where should I open a coffee shop in Denton County?"
Keep building with follow-ups
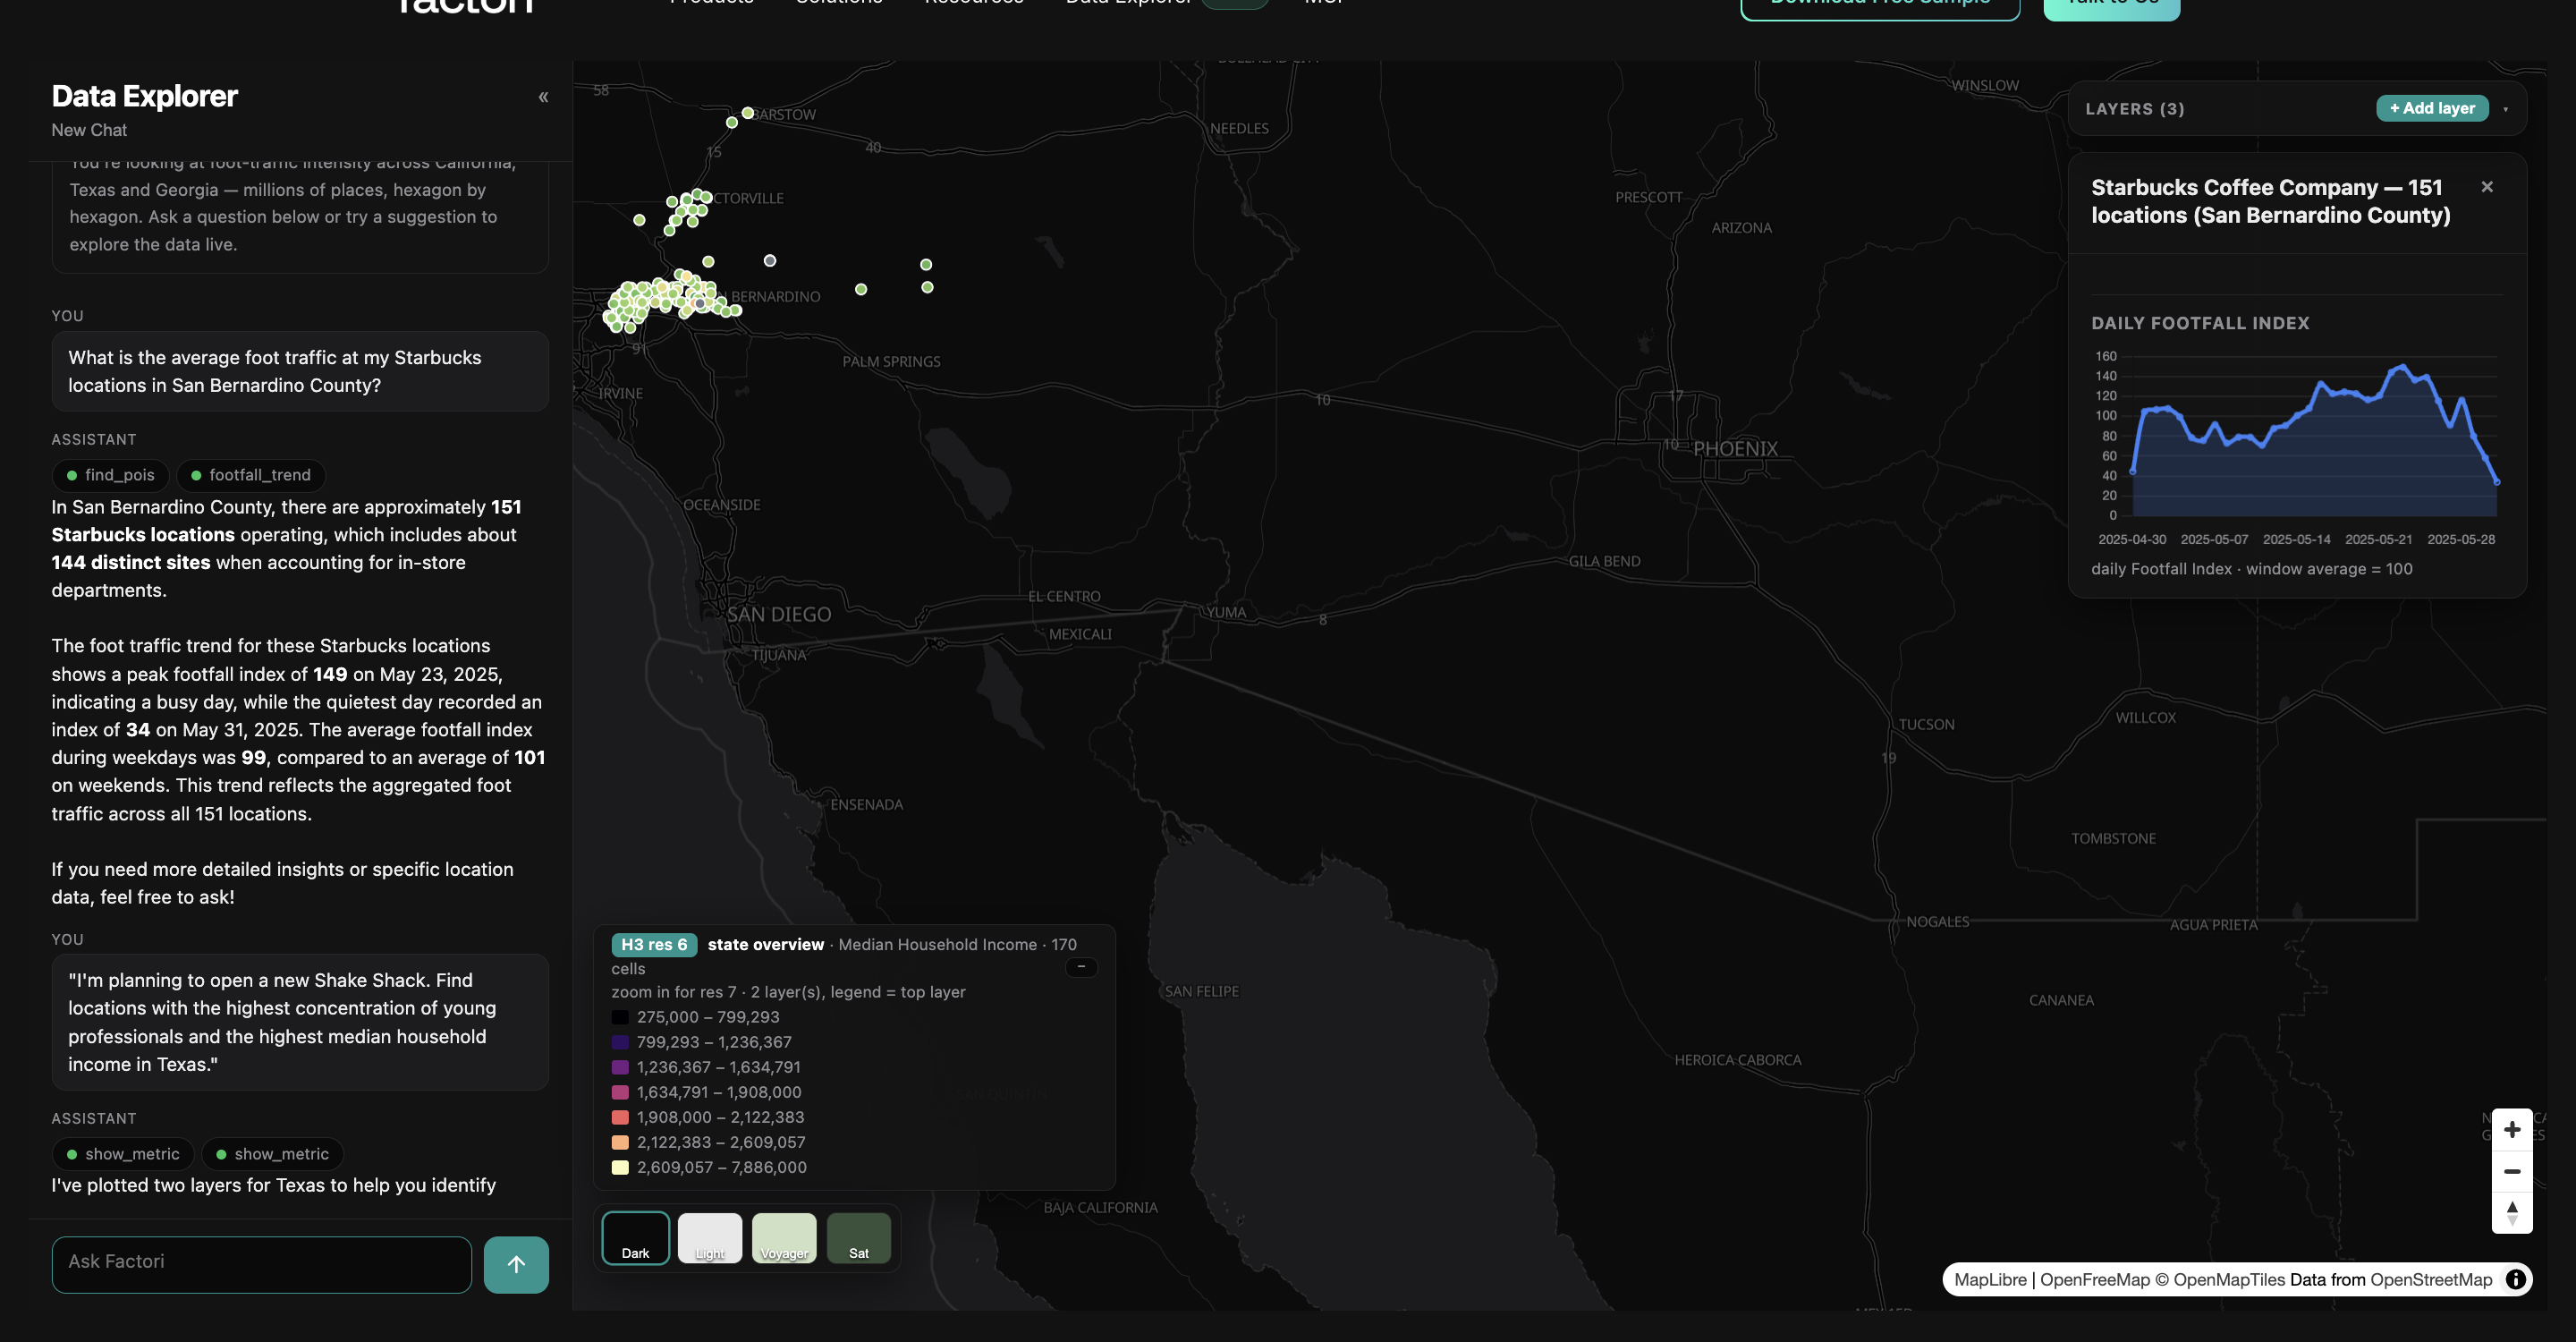
After an answer, keep going conversationally: "now show the same for the next county" or "add income on top." The map updates without starting over.
Starting fresh
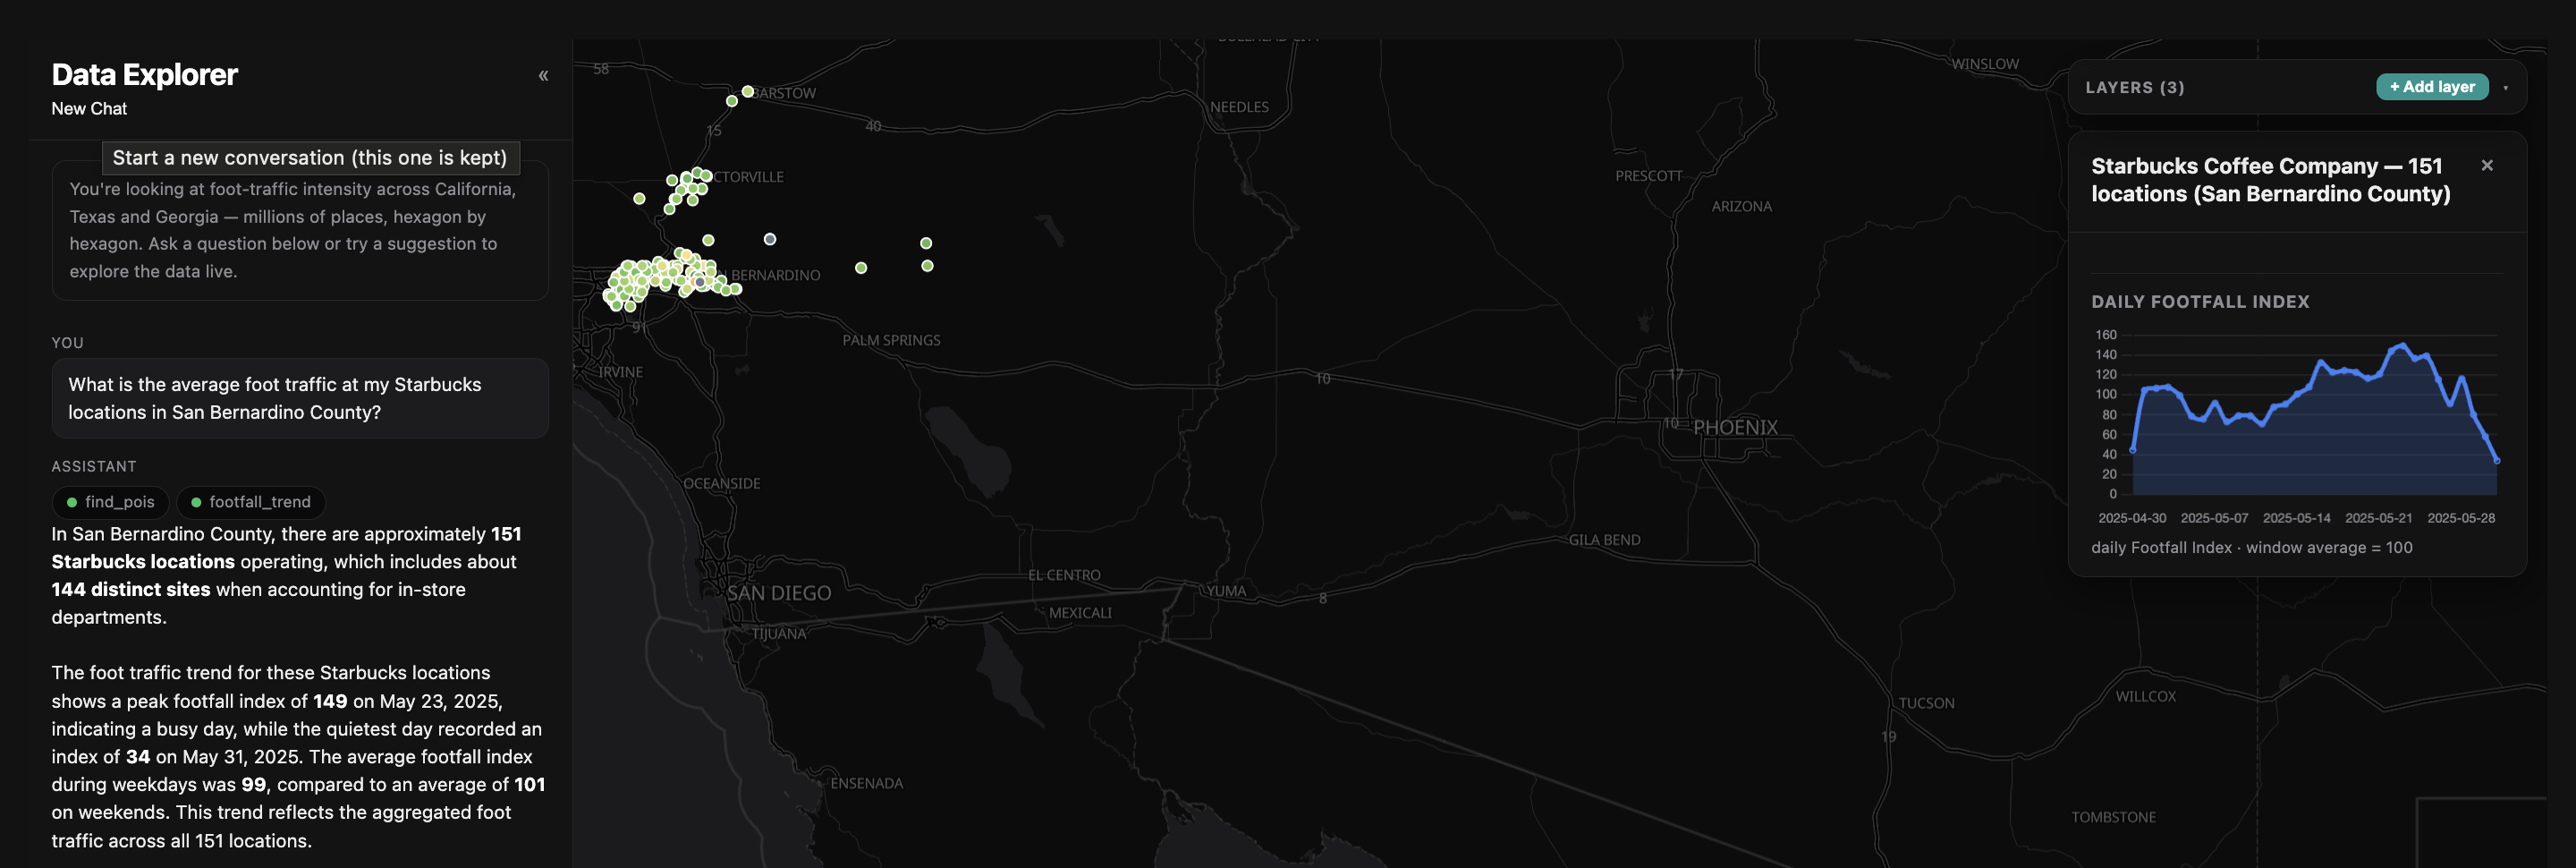
Click New Chat any time to clear the conversation and the map.
Updated 21 days ago